Custom Trading Terminal
About the Project
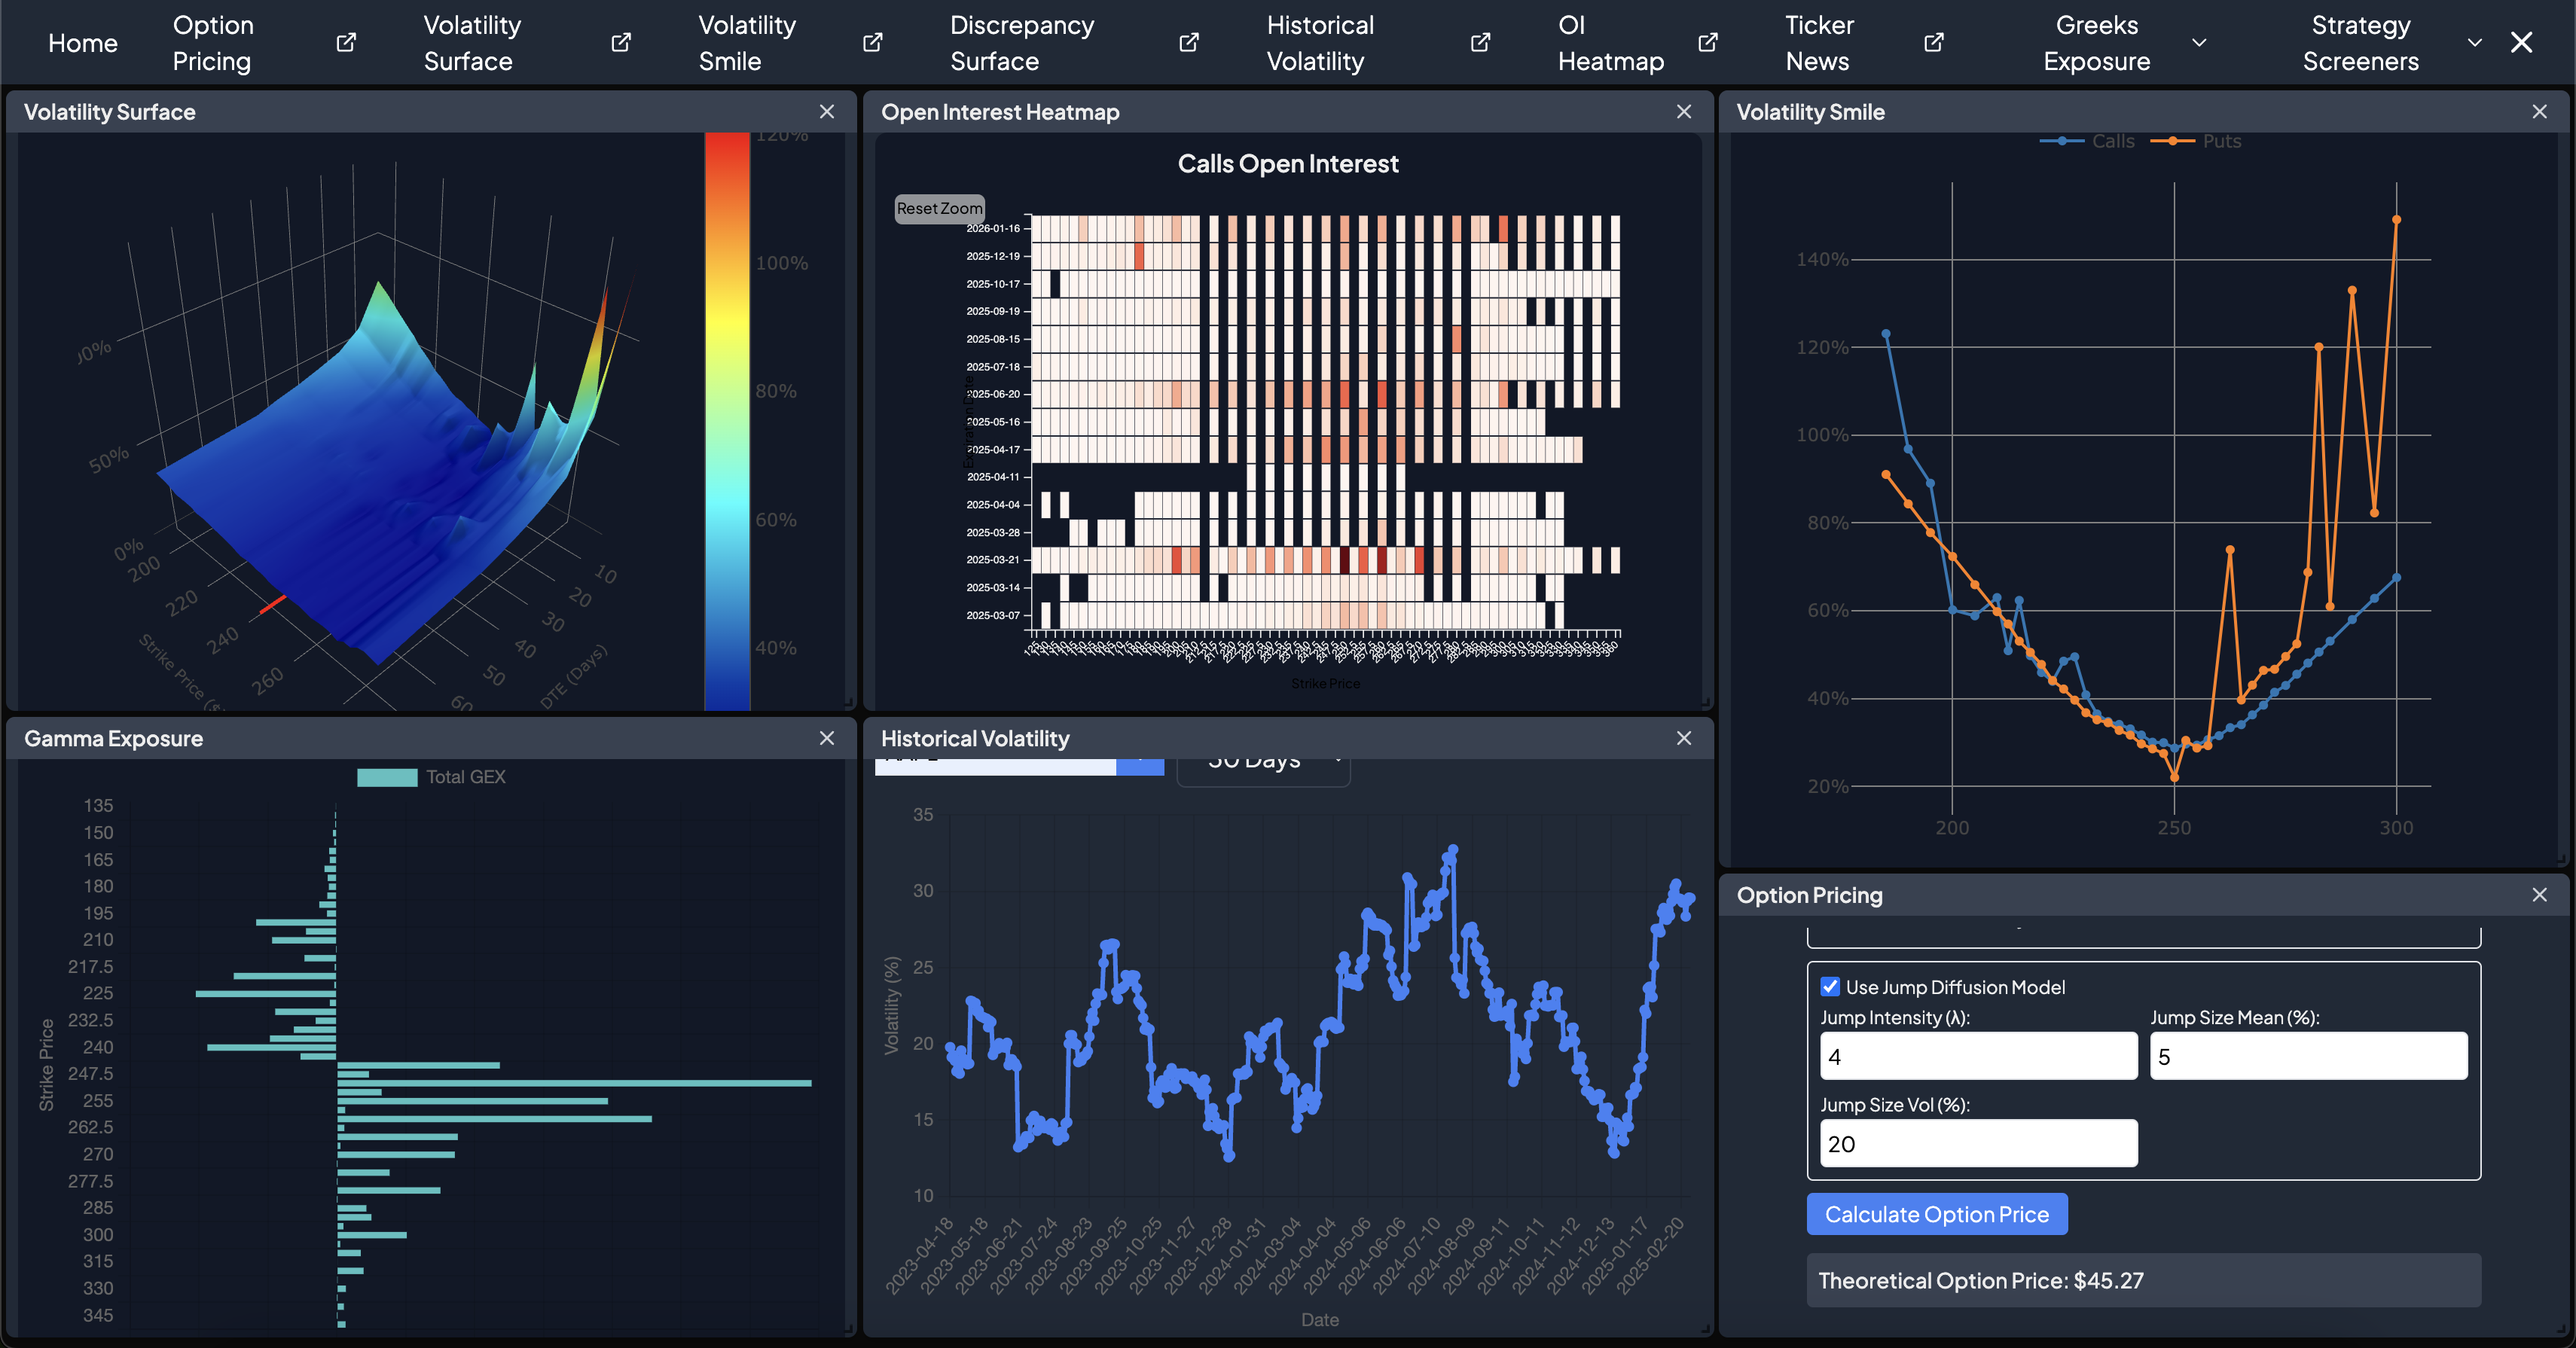
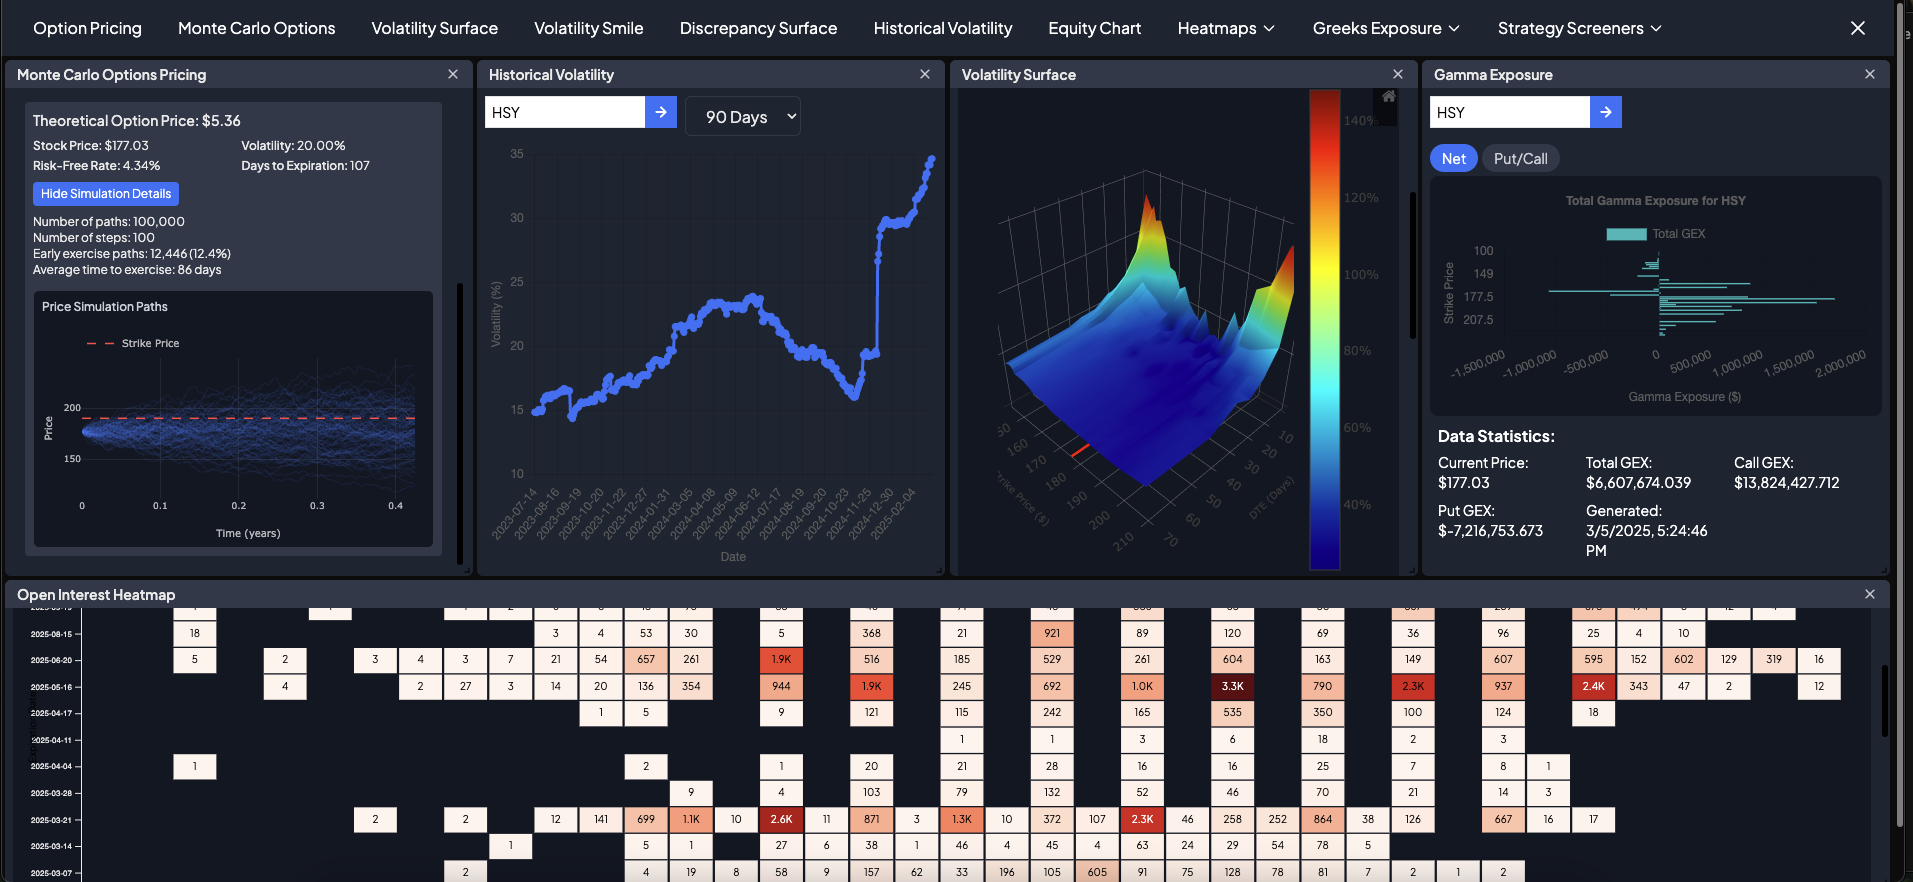
This is a custom-built trading terminal that I developed as a Next.js web application. The terminal runs locally on my machine and provides real-time market data, analysis and visualizations. I chose to build this using this framework for the user interface because it was easier to impliment than a custom interface and it can be easily shipped as a live webapp. I use this app regularly as part of my analysis for my real world trading.
Features
- Dynamic masonry style interface that allows the user to customize the size and placement of components on the dashboard
- Option pricing
- Standard(BSM variant)
- Standard with jump idffusion parameters
- Monte carlo simulation
- Volatility surface
- Volatility smile(skew)
- Historical volatility graph of a given US equity
- Historical US equity price and volume chart
- Heatmaps
- Open interest
- Volume
- VWAP
- Greeks
- Greeks exposure graphs
- Gamma
- Delta
- Vanna
- Charm
- Strategy screeners
- Long call/put
- Covered call
- Cash secured put


